|
|


Environment - San Diego Sea Level History (from NOAA)
John S. Stokes III
john.s.stokes3@gmail.com
https://www.instagram.com/johnstokesiii/
|
|
Environment - San Diego Sea Level History (from NOAA)
John S. Stokes III
john.s.stokes3@gmail.com
https://www.instagram.com/johnstokesiii/
San Diego average sea level by month
1906 through 2023
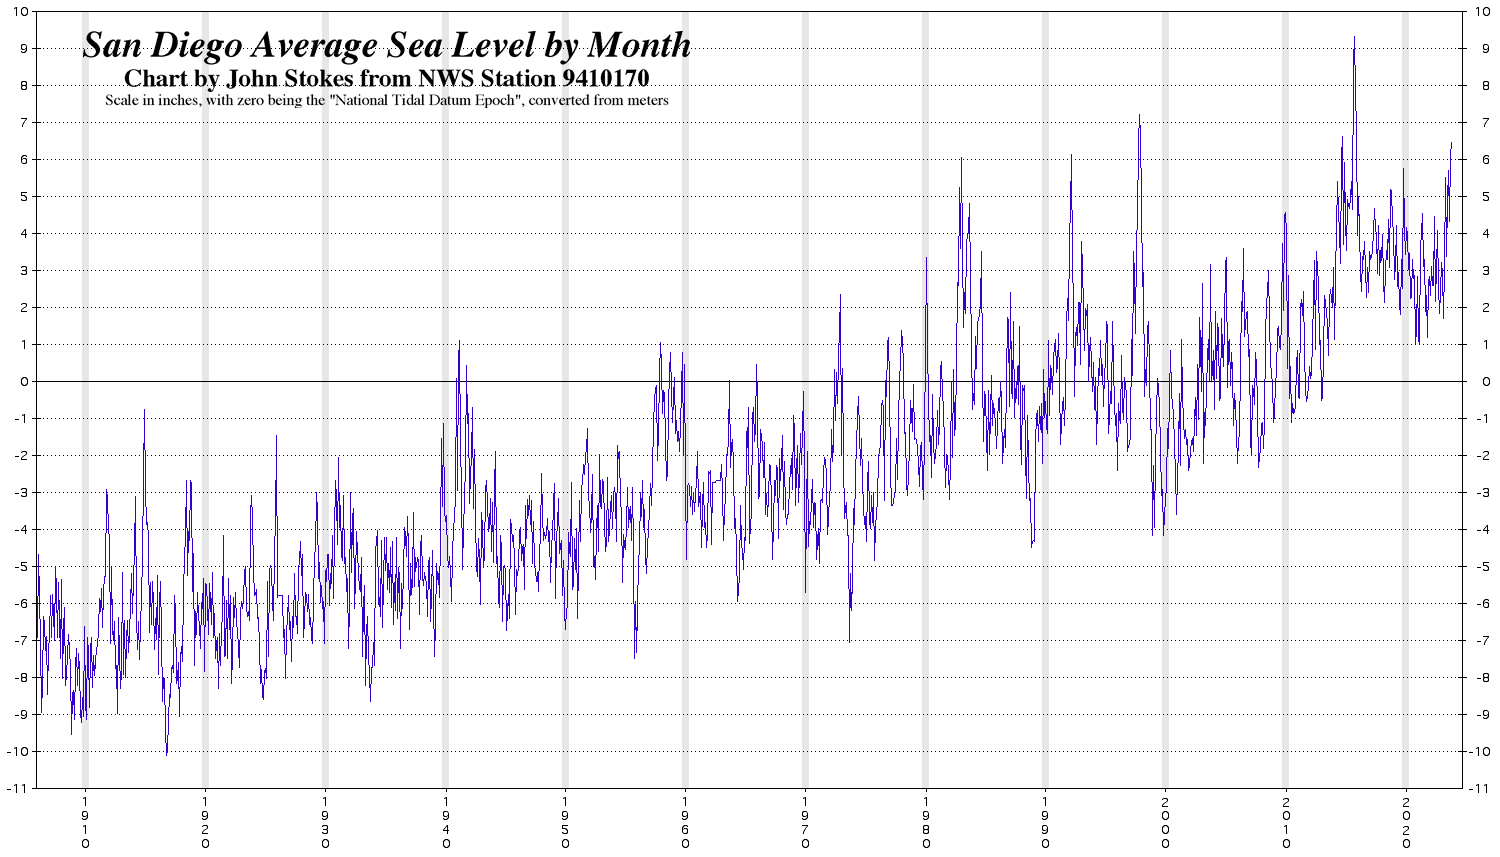
Information obtained from the National Weather Service station 9410170 and derived - https://tidesandcurrents.noaa.gov/sltrends/sltrends_station.shtml?id=9410170
Scale in inches, with zero being the "National Tidal Datum Epoch", converted from meters
Note: data is missing for the first six months of 1926 and has been interpolated
I update this chart annually
soon after the yearly data is in (usually late January).
San Diego average sea level by year
1906 through 2023
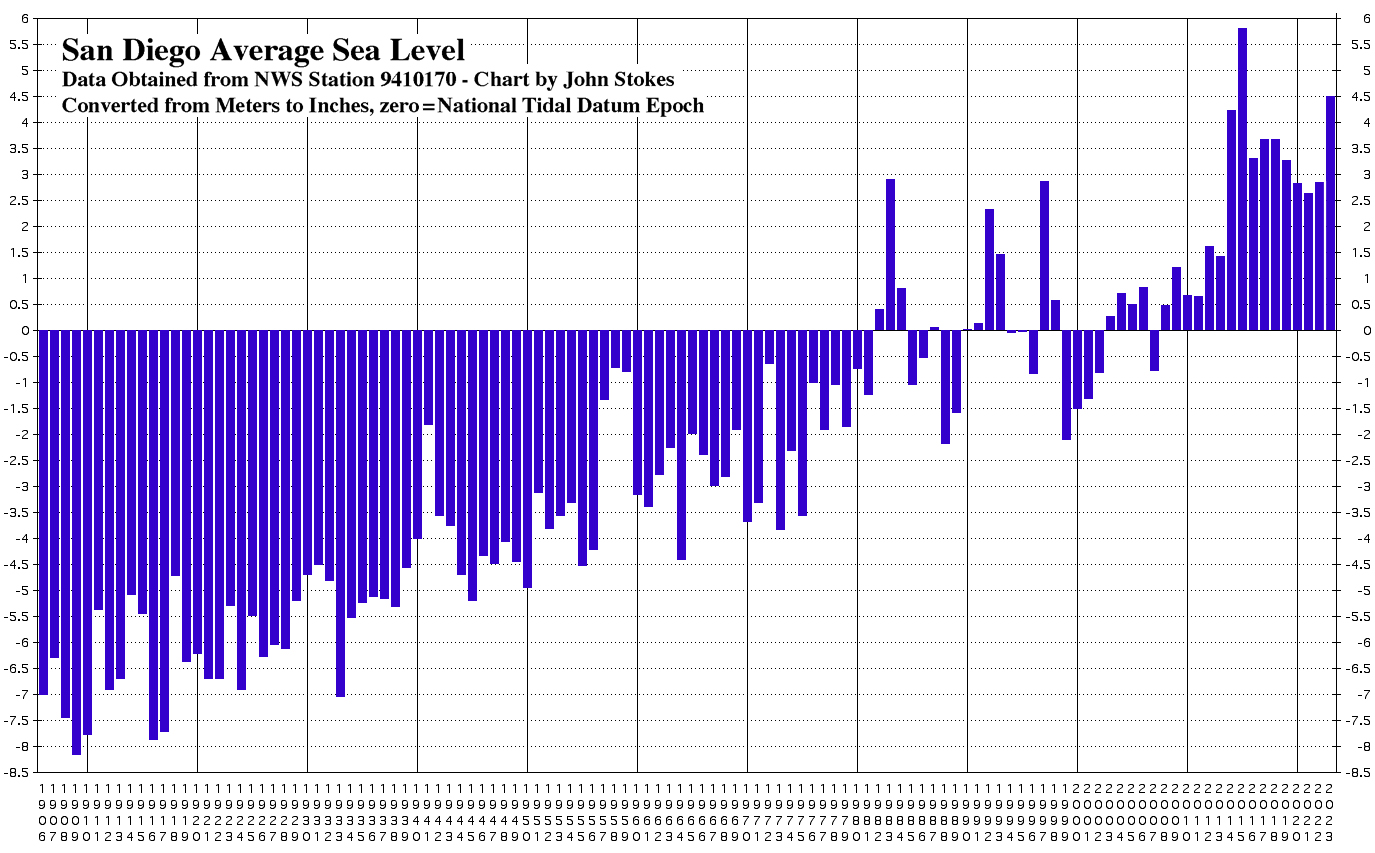
The overall presentation shows a fairly linear increase at about .75 to .80" per decade
Year 2023 - Posted January 31, 2024: The long term trend remains up. The average sea level for 2023 jumped more that 1.5" from 2022, reaching the highest level in 8 years and solidly confirming the uptrend. These big one year increases are ususally followed by a decrease in the following year. We shall see.
Year 2022 - Posted January 31, 2023: The long term trend remains up. The average sea level ticked up slightly getting back to the 2020 average level.
The question to be answered here for San Diego is "How much of the increase is due to melting ice / ocean thermal expansion versus local land subsistance?" NOAA at https://climate.nasa.gov/vital-signs/sea-level/ says that for the period 1993 through November 2022, the world sea level has risen 103.0 millimeters. This is just about .14 inches per year. My chart from 1906 to 2022 shows about .086 inches per year. Various other sources show similar long term data with a suggestion that the rate has increased in the past 10-20 years. However(!), in Science, July 31, 2020 there is an article "Tracking California's sinking coast from space: Implications for relative sea-level rise". See https://www.science.org/doi/10.1126/sciadv.aba4551. This article indicates that "San Diego and the surrounding area are characterized entirely by subsidence... with rates reaching -2.7 mm/year". (Datasets 2007-2018 with gap between 2011-2014). -2.7 millimeters per year works out to about .106" inches per year. This would indicate that if true over the past 100 years all of the local sea level increase has been due to subsidence and not melting and heating. None-the-less the satellite data definitively shows worldwide increase. So... something doesn't add up. Thank you Jim Call for initiating my investigation into this issue.
Year 2021 - Posted January 30, 2022: The recent downtrend continues with the average annual level now at its lowest level in seven years. The regression to the overall upwards trend line continues with no sign of a runaway trend developing.
Year 2020 - Posted January 29, 2021: Although the century long trend remains up, San Diego experienced the lowest average sea level in six years. This regression to the trend line reinforces the idea that the overall long term increase is linear and that the slight increase in the rate of increase mentioned in 2019 regarding the 2018 data has not continued to develop. Of course the situation will continue to be monitored.
I won't be updating the sea level by decade chart for the 2020's until at least three years of decade data is available. Edit January 31, 2023 - I have discontinuned this feature.
Year 2019 - Posted February 3, 2020: The trend remains up. For the sixth consecutive year, the level remains above 3". 2019 was lower than 2018, but streak of more than 3" readings continues. Impressively, there were no yearly averages above 3" before the streak started. The 2019 level only slightly backs off a suggestion of acceleration. Meanwhile, with the end of year 2019, the decade has ended, and the average sea level figure for the full decade computed. The decade jump is the biggest of the series.
Year 2018 - Posted February 1, 2019: The trend remains up. For the fifth consecutive year, the level remains above 3". 2018 was almost exactly the same as 2017, a tiny bit lower but rounded to the same pixel height in the chart as 2017. The chart suggests a slight increase in the rate of increase over the longer run. Next year will reveal more about this suggestion.
Year 2017 - Posted January 27, 2018: The trend remains up. This is the fourth year in a row with the level above 3", the only four times in the history since 1906 that the level has been above 3". 2017 saw a slight increase over 2016, but below the 2014 and 2015 record levels. FWIW the latest four year local average annual temperatures are also in a record streak.
Year 2016 - Posted January 26, 2017: My guess last year that sea levels would drop locally this year was correct. However the 2016 level is the third highest on record!
May 18, 2016: The April sea level data is out and as I guessed on Feb 1, the levels have continued to drop towards the long term up trend line with the April level at about 2.6".
February 22, 2016: The New York Times published an article on their website saying the oceans are rising faster than any point in the last 28 centuries: https://www.nytimes.com/2016/02/23/science/sea-level-rise-global-warming-climate-change.html
Year 2015 - Posted February 1, 2016: Again the collective data flashes a warning for global warming. The levels for 2015 set a new record, although levels did pull back a bit in November and December. Current thought is the increase is due to a persistent area of warm water off the immediate coast and the 2015-2016 El Niño. Chances are the sea will fall back in 2016, although maintaining the long term trend of gradual increases. Also, on January 29 Arctic Sea Ice was at the lowest levels for that date since recording began around 1980.
Further research:
Is the sea level rise accelerating? - http://www.skepticalscience.com/print.php?r=365
Other areas of possible ocean research:
- Ocean acidity
- Coral health
- Dead zones
- Ocean Temperature