|
|


Environment - Antarctic Sea Ice Coverage (from The National Snow & Ice Data Center)
John S. Stokes III
john.s.stokes3@gmail.com
https://www.instagram.com/johnstokesiii/
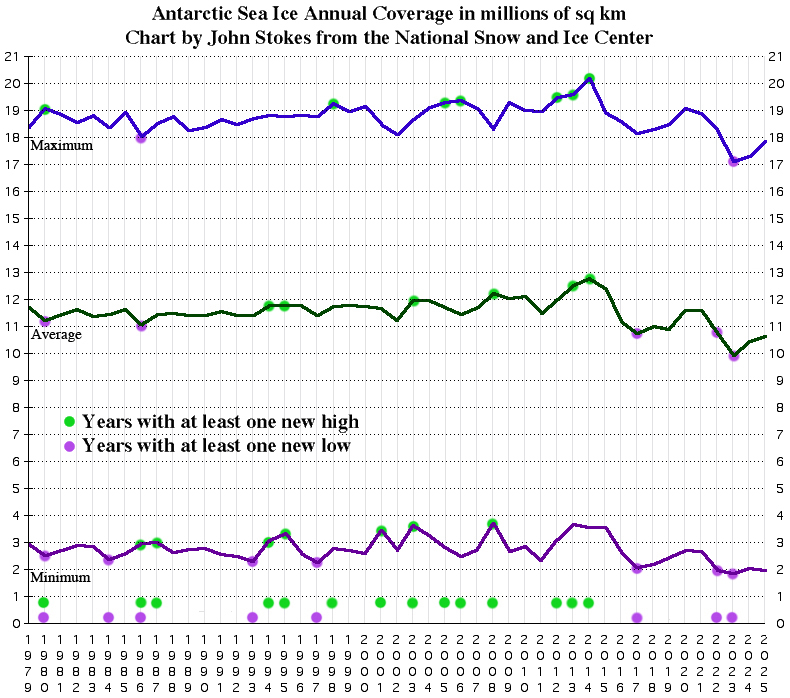
Antarctic Sea Ice Coverage in Millions of Square Kilometers by year
Chart updated once a year, usually in January
Chart derived from data made available by the National Snow & Ice Data Center: http://nsidc.org/arcticseaicenews/
Top line: Annual Maximum
Middle line: Annual Average
Lower line: Annual Minimum
Green dots indicate new highs
Purple dots indicate new lows
Analysis
From the late 1970s when monitoring of the Antarctic Ice shields systematically began until 2014 the ice extent gradually increased counterbalancing the more rapid decrease of the Arctic Ice shields. Since 2014 the trend for the Antarctic reversed with notable declines in 2022 and 2023.
Year 2025 - Posted January 8, 2026 - The maximum and average ice extents continued their rebound while continuing to track lower than the previous levels. The minimum declined slightly and remains near the low set in 2023.
Year 2024 - Posted January 6, 2025 - The maximum, minimum and average ice extents all rebounded a bit off of last year's lows. I realized that last year I was using 5 day moving average data instead of daily data. So for this year's update I downloaded the full data set and laboriously re-did the whole chart. Everything is virtually the same, with minute differences. Separately, as an exercise I created a combined dataset averaging the average data for both hemispheres. The graph, not published here, shows a somewhat gradual downslope in world ice. I can make the graph available on request.
Year 2023 - Posted January 2, 2024 - The latest year saw a dramatic drop with the maximum, minimum and average all setting record lows. I found a file at the National Snow and Ice Center which does all of the regional combining, making updating the chart far simpler, I missed it last year. I was happy to see I did excellent work for the 2022 chart as the 2023 overlaid perfectly, no corrections needed! The year end figure was trending towards the longer term average. Like the Arctic, we shall see next year!
Year 2022 - Posted July 20, 2023 - Introducing my coverage of the Antarctic Ice shields! The figures are combined from daily measurements of the Amundsen-Bellingshausen area ice extent, the Indian area ice extent, the Pacfic area ice extent, the Ross area ice extent and the Weddell Sea area ice extent as provided by the National Snow and Ice Center, at https://nsidc.org/arcticseaicenews/sea-ice-tools/ - daily sea ice extent by region (S_Sea_Ice_Index_Regional_Daily_Data_G02135_v3.0.xlsx). I interpolated the missing data covering the last 26 days of 1987 and the first 13 days of 1988 with little or no effect on the chart for those years. Considerable rearranglement of the data was required to create this chart!
The data shows a rather steady year to year pattern. However the green dots of the slowly increasing ice extent trend have transitioned to purple dots in recent years, likely reflecting the global warming trend. Of concern, the annual low ice extent for the Antarctic summer has set a consecuitve low per the 2023 data for this period and the daily data trend indicates that the Antarctic's winter maxium could be well below the low set in 1986. To be monitored.