|
|
Environment - Arctic Sea Ice Extent (from The National Snow & Ice Data Center)
John S. Stokes III
john.s.stokes3@gmail.com
https://www.instagram.com/johnstokesiii/
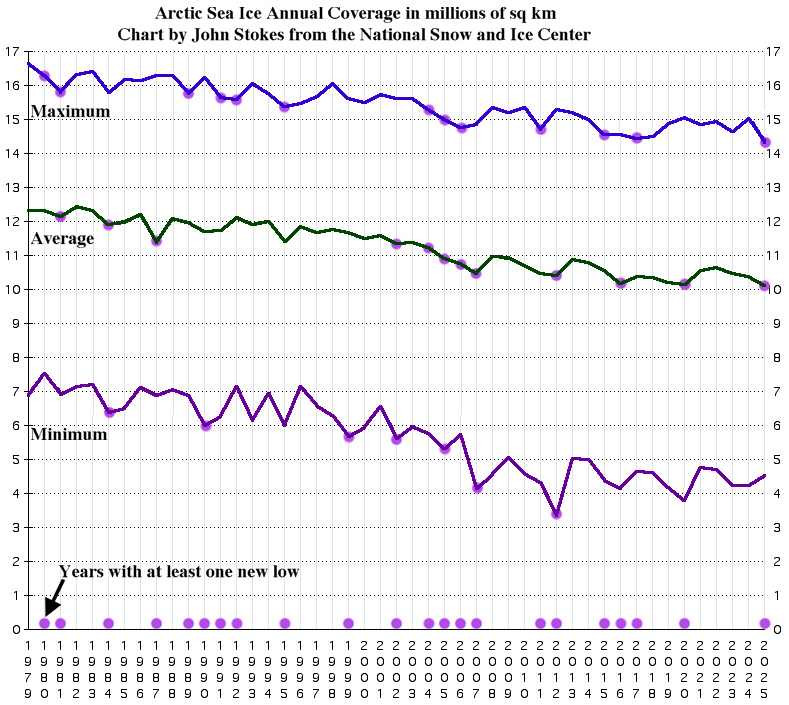
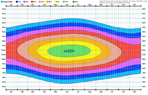
Arctic Sea Ice Extent in Millions of Square Kilometers by year
Chart updated once a year, usually in January
Chart derived from data made available by the National Snow & Ice Data Center: http://nsidc.org/arcticseaicenews/
Top line: Annual Maximum
Middle line: Annual Average
Lower line: Annual Minimum
Purple dots indicate new lows
Analysis
Since the Arctic Sea Ice extent has been systematically monitored by satellite starting in the late 1970's, the maximum, minimum and annual average for each year have been in a generally declining trend although in recent years the evidence has been weak.
Year 2025 - Posted January 8, 2026 - For 2025 the maximum decreased markedly, setting a new low. The average declined a little, also setting a new low. The minimum increased to a 3 year high. Overall, the downward trend has resumed, although the extreme minimum set in 2012 still reigns untouched.
Year 2024 - Posted January 6, 2025 - For 2024 the maximum increased markedly, to the biggest extent since 2013. The average for the year declined slightly while the minimum was essentially unchanged. Basically, there has been no decline in the last decade.
Year 2023 - Posted January 2, 2024 - The latest data file contained some tiny adjustments for year 2022 with no visible change in the chart. For 2023 the maximum, mininum and average all declined significantly, the first time this has happened since 2015. However none of the figures reached record lows. Furthermore, the year-end figure was considerably higher than the previous year-end. We shall see next year!
Year 2022 - Posted January 1, 2023 - The latest data file contained some minor adjustments for year 2021 and the chart has been adjusted accordingly. The latest year showed little change from the previous year, continuing the relatively steady levels since 2007.
Year 2021 - Posted January 1, 2022 - The latest data file contained some minor adjustments for the previous few years. I redid the complete chart although the prior data is essentially identical. The 2020 average value, which was just a tiny bit above the 2016 record low is now a tiny bit below the 2016 figure, so a purple dot was posted to the chart for 2020. For the latest year, 2021, the reverse of the previous two years: the maximum decreased and the minimum increased. The average, while still in a downtrend, was well above the previous year's record low. One possibly significant datapoint is the 2021 year ended with the most ice in over a decade for a year-end figure. Since 2007 the ice levels have been relatively steady to compared the sharp drops of the prior 10 years.
Year 2020 - Posted January 2, 2021 - In a repeat of the previous year, the maximum Arctic ice coverage increased and the minimum coverage decreased. The overall trend of gradual ice coverage decline continues. The year's minimum was the second lowest. The average coverage declined ever so slightly, also at a second lowest level (edit, with a data revision next year, made a new low).The maximum coverage reached a seven year high although the thickness has decreased.
Year 2019 - Posted January 1, 2020 - In the past year the maximum Arctic ice coverage increased and the minimum coverage decreased. What to make of this? Looking at the average coverage for the year, there was a decline and to a level just above the record low in the 40 years satellite record. So the slow overall decline continues, while a run-away collapse remains to be seen. The year-end figure for 2019 was at a five year high.
Year 2018 - Posted January 1, 2019 - There was just a slight down-tick in Arctic ice coverage during 2018. The year's maximum came in just a little higher than the 2017 record low. The average coverage figure declined slightly with the average coming in also at a second lowest reading. The minimum figure declined slightly from last year, but remains well above the record low set in 2012. I don't see a run-away collapse here nor do I see an ice-free Arctic anytime soon. However the general gradual melting trend remains intact with future consequences to be revealed.
Year 2017 - Posted January 4, 2018 - I now have a new data source, The National Snow & Ice Data Center. Their figures follow the pattern of the prior dataset obtained from JAXA Satellite Monitoring of Environmental Studies but in general are a few percent higher. Some of my prior comments have been invalidated going by the new data source, thus I've deleted them here. I've completely revamped the chart. I've added marks (purple dots) to each of the maximum, average and minimum graphs whenever a new annual low was reached. The annual minimum graph made a headliner low in 2012 triggering fears of an ice-less summer in the near future. However, the minimums in the past five years have remained above that level. None-the-less the overall decline in Arctic ice continues, as a new low in the maximum annual ice was reached last year (2017) following a new low in 2015. The average annual ice extent ticked up just slightly from latest low made in 2016. Furthermore, not shown in the chart, is that the year-end figure for 2017 (12.418) set a new year-end low.