|
World Atmosphere - Methane Levels
|
Environment - World Atmosphere - Methane Levels (from NOAA)
John S. Stokes III
john.s.stokes3@gmail.com
https://www.instagram.com/johnstokesiii
Methane is the number two greenhouse gas in the atmosphere in terms of effect (quantity x potency)
Annual Average Methane levels (parts per billion) by Year
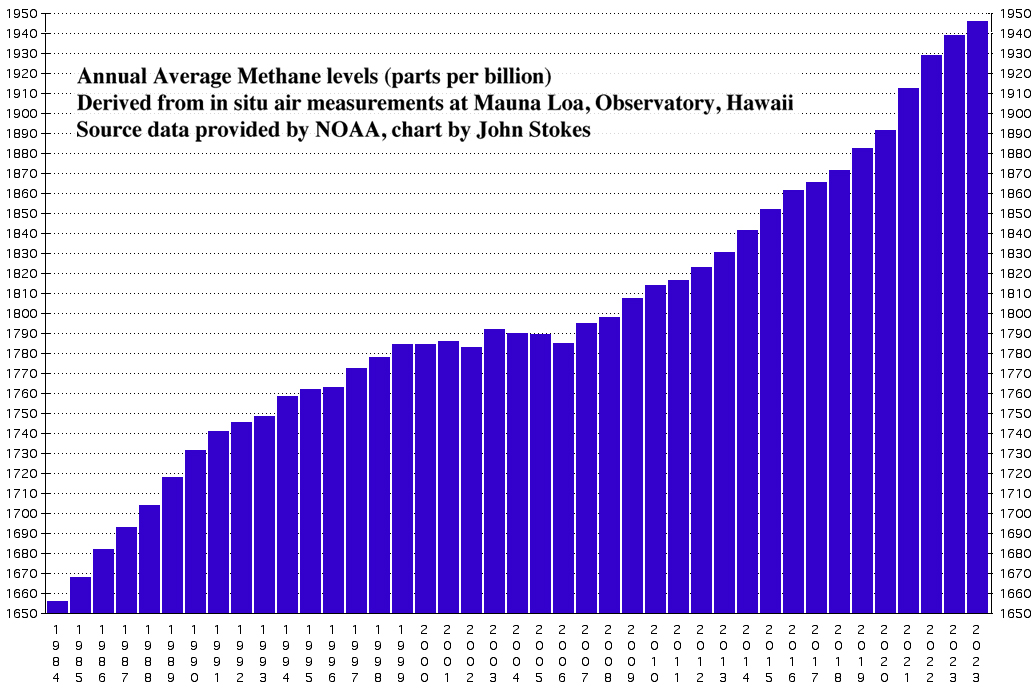
Average Methane Levels by Year
Information obtained from the NOAA Earth System Research Laboratory
https://gml.noaa.gov/aftp/data/trace_gases/ch4/flask/surface/
Measurements taken at Mauna Loa Hawaii.
Annual numbers derived by averaging monthly figures for each year.
This chart is updated once a year, after the data is posted by NOAA - posting has ranged from late February to late August
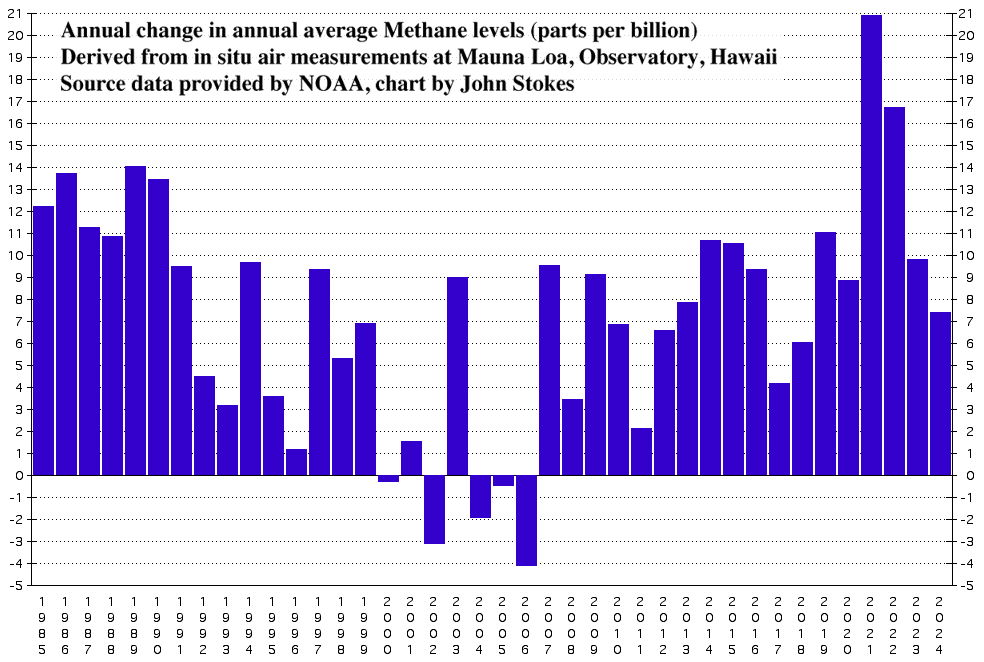
Annual Change in Average Methane Levels by Year
Analysis
The increase in Methane has been generally ongoing since records have been kept, starting in 1984 except for a lull in the early 2000's. Current levels are unprecedented going back over 400 thousand years.
While the annual CO2 equivalence of Methane emissions is currently about a quarter of CO2, the fear is as oceans continue to warm and tundras melt a feedback loop will be triggered which will cause run-away massive levels of trapped Methane to escape into the atmosphere causing huge ecological changes which could bring about mass extinctions, including our own. So far, the worrisome uptrend in Methane levels which resumed in 2007 has been linear. Rather than wait for tipping point acceleration in the trend line, increased world wide action is required at an extraordinary level to turn these graphs of CO2 and Methane levels to the down side.
Year 2024 - Posted July 26, 2025: The uptrend continues with 2024 setting a new record high for the 18th year in a row. The increase was 7.4 parts per billion, the lowest in the last six years, close to the dataset annual average increase of 7.26 parts per billion. I had to derive the data from daily "in-situ" measurements instead of monthly "flask" measurements. Normally these figures are very close, used to confirm the data. Hopefully the charts here are reflecting reality closely. I've contacted NOAA seeking their flask data for 2024. While the continued increase is a major concern, maybe the slowdown in the increase will continue.
Year 2023 - Posted August 10, 2024: The uptrend continues with 2023 setting a new record high for the 17th year in a row. The increase was 9.8 parts per billion, the lowest in three years, but still above the dataset annual average increase of 7.19 parts per billion. Once again there were some very tiny changes to the data in some of the prior years but not enough to change the appearance of the chart. Will the amount of increase decrease again next year for the third year in a row? We must wait.
Year 2022 - Posted August 30, 2023: The data came out later than normal this year. I replaced the charts and comments I posted earlier which had estimated 2022 data. Once again, methane levels took a big annual jump. Not has big as 2021 but still huge keeping the uptrend well in place. The data file I used contained monthly data instead of daily, the annual figures for prior years are different but not enough to change the story. The monthly series went back to mid 1983, so I was able to add annual figures for 1984-1987 and annual difference data for 1985-1988.
Year 2021 - Posted March 24, 2022: Unfortunately 2021 saw a record jump in the methane levels recorded at Mauna Loa, by far the biggest jump since records begin in 1987. Why? Apparently increased pipeline venting in 2021, perhaps as the Covid downturn lead to more catch-up activity? In any case we as a planet are going in the wrong direction and at a more rapid pace!
Number of day with readings above 1900 last year: 286
Year 2020 - Posted April 7, 2021: Methane jumped again almost as much as last year's big jump despite reduced world wide activity due to the COVID-19 pandemic.
Number of day with readings above 1900 last year: 151
Year 2019 - Posted April 18, 2020: Methane levels soared in 2019, the biggest jump in 28 years, to a new rccord level. Currently the COVID-19 virus pandemic is sweeping Earth, and due to much lower fossil fueled machine activity, particulate pollution has drammatically dropped per satellite observations. Beautiful blue skies are visible in Delhi, India recently one of the most polluted cities. Will methane levels reflect this in the 2020 data? I don't have a daily methane level data source, will have to wait for now.
Number of days with readings above 1900
2013 - 0 (and before 2013)
2014 - 1
2015 - 1
2016 - 6
2017 - 19
2018 - 31
2019 - 77
Year 2018 - Posted March 5, 2019: Methane levels increased for the 12th year in a row although the amount of increase has decreased for the third year in a row.
Year 2017 - Special Note - (edited March 31, 2018 to reflect final data):
For the preliminary data bar chart for 2017, shown earlier in the year, I assumed that the extreme outlier datum for November 20, 2017 was a preliminary-data error and for that day's value instead I used the average value of the day before and after when computing the year's average figure, trimming the annual figure by about 0.30. The day figure was 2006.73. Upon inquiry about this outlier, the early indication is that this figure was real, that a "really strong, fast transport from Asia, up to Alaska, then down to MLO" (Mauna Loa Observatory) brought in "strong Asian emissions combined with the effect of the N/S latitude gradient". The intensity of this event was a very rare event as there nothing else in the full daily record which comes close to this (there are a couple dozen days or so when the values have been within the 1900-1920 range, all in the past two years). In the final bar chart this value was included when figuring the annual average.
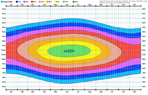
NASA provided me with an air flow trace-back diagram illustrating the origins of the air sampled many times during the day before, the day and the day after the 2006.73 reading of November 20. Very cool!!
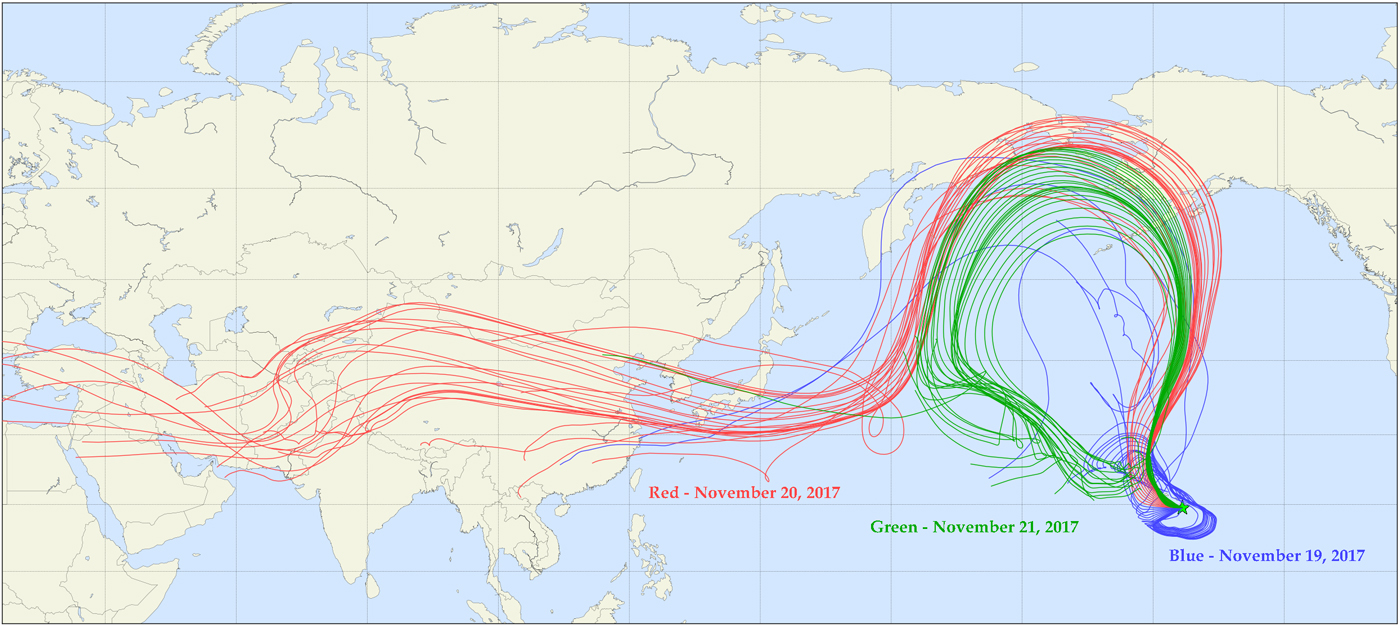
Methane sampling air mass trace back - November 19-21, 2017
The Green Star is the location of the Mauna Loa Observatory in Hawaii
Image provided by NASA (scaled and text added here)
According to the EPA (http://epa.gov/climatechange/ghgemissions/gases/ch4.html), the sources of Methane emissions in the United States are:
29% - Natural Gas and Petroleum Systems (e.g. leaks in pipelines, gases escaping during fracking)
25% -
Enteric Fermentation (e.g. gases from digestion released by cow belching and farting)
18% - Landfills
10% - Coal Mining
9% - Manure Management
9% - Other
Sam Carana at http://arctic-news.blogspot.com looks at the global method emissions and suggest large quantities are also being emitted via nature sources, some accelerated by global warming
28.1% - Wetlands
25.9% - Ruminants, Rice growing, Landfills and Waste
17% - Fossil Fuels and Biomass Burning (includes Biofuels)
16% - Other natural sources (Geological, lakes, wildfires, termites, etc.)
13% - Hydrates and Permafrost