|
|
Environment - World Atmosphere - Carbon Dioxide Levels (from Scripps & NOAA)
John S. Stokes III
john.s.stokes3@gmail.com
https://www.instagram.com/johnstokesiii/
Carbon Dioxide (CO2) is the number one greenhouse gas in the atmosphere in terms of effect (quantity x potency)
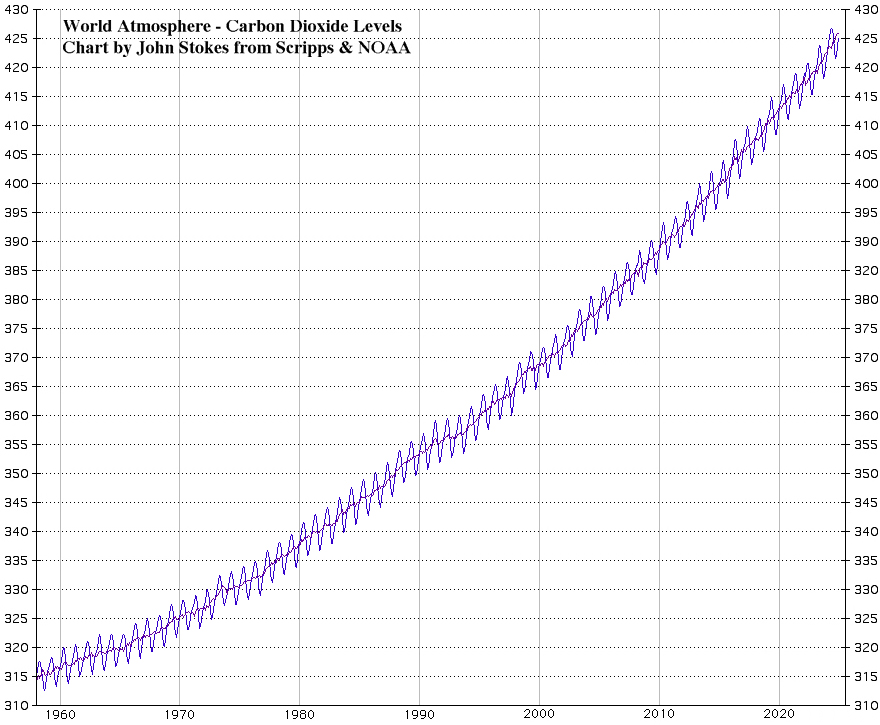
Monthly CO2 levels (parts per million)
March 1958 through December 2024
Derived from in situ air measurements at Mauna Loa, Observatory, Hawaii

Monthly CO2 levels (parts per million)
This chart is updated once a year after each year's data is in, usually by mid January
Source file obtained at https://scrippsco2.ucsd.edu/data/atmospheric_co2/mlo.html
Wavy line sourced from column 9 in the data file: monthly "Mauna Loa CO2 concentrations in micro-mol CO2 per mole (ppm), reported on the 2008A SIO manometric mole fraction scale".
This is the "standard version of the data most often sought". Several instances of missing data filled with smoothed data (in column 7 of the data file).
Smoother line sourced from column 10 in the data file, derived from the same source data but with seasonality smooth out.
Daily social media postings of the CO2 reading are at X Keeling Curve
The website with the latest CO2 reading may be obtained at Keeling Curve
Credits excerpted here from the file's header section
Atmospheric CO2 concentrations (ppm) derived from in situ air measurements
at Mauna Loa, Observatory, Hawaii: Latitude 19.5° North Longitude 155.6° West, Elevation 3397 meters
Source: R. F. Keeling, S. J. Walker, S. C. Piper and A. F. Bollenbacher
Scripps CO2 Program ( http://scrippsco2.ucsd.edu )
Scripps Institution of Oceanography (SIO)
University of California
La Jolla, California USA 92093-0244
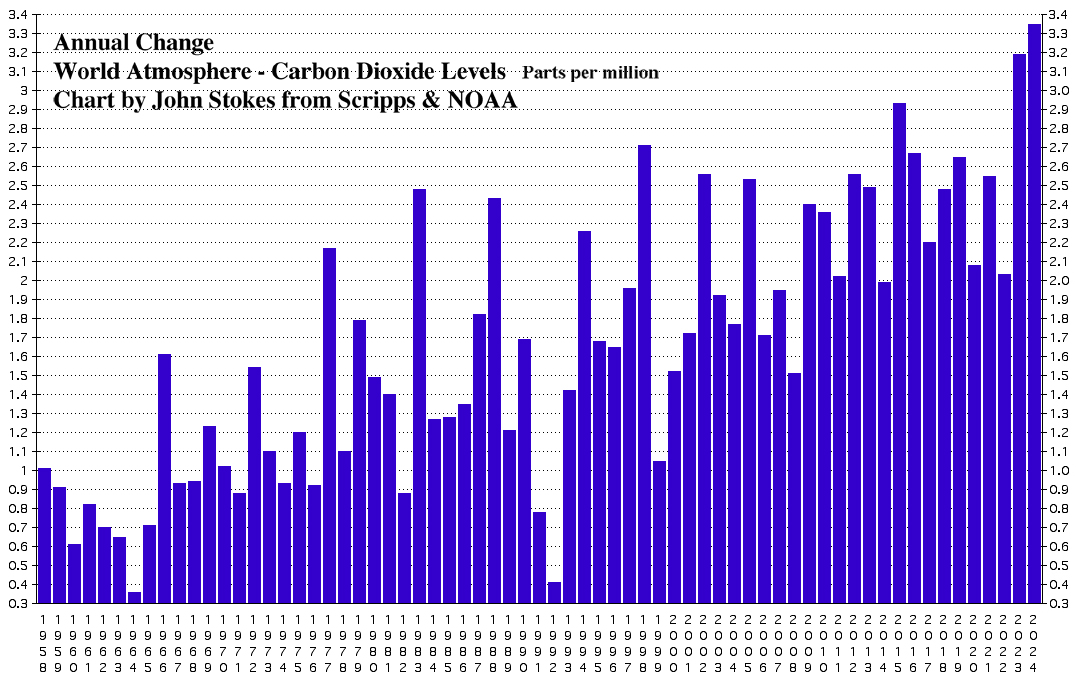
Annual CO2 level changes (parts per million)
Derived from in situ air measurements at Mauna Loa, Observatory, Hawaii

Annual CO2 level changes (parts per million)
Analysis
The increase in Carbon Dioxide has been relentless since records have been kept . Current levels are unprecedented going back over 1/2 million years.
Year 2024 - Posted January 4, 2025: In 2024 the relentless increase in Carbon Dioxide levels in the atmosphere continued. The amount of the increase in 2024 SET A RECORD increasing by 3.35 parts per million, breaking the record increase of last year. The data set was revised a bit last year, with some differences increasing and some decreasing in recent years with the overall change the same. The chart has been updated accordingly. Last year's increase was revised to 3.19 up from 3.09.
Year 2023 - Posted January 10, 2024: In 2023 the relentless increase in Carbon Dioxide levels in the atmosphere continued. The amount of the increase in 2023 SET A RECORD increasing by 3.09 parts per million, way above last year's increase and breaking the record increase of 2.94 set in 2015. This Carbon Dioxide increase corresponds to the record increase in global average temperature for 2023 per Climate Copernicus 2023.
Year 2022 - Posted January 12, 2023: In 2022 the relentless increase in Carbon Dioxide levels in the atmosphere continued. The rate of increase decreased over last year's rate of increase although remained above the 2 parts per million rate of increase for a record 8th year in a row. Note: There were slight revisions to the 2021 data causing the increase to drop by one pixel on the chart (from 2.56 to 2.55).
Year 2021 - Posted January 15, 2022: In 2021 the relentless increase in Carbon Dioxide levels in the atmosphere continued. The rate of increase increased over last year's rate of increase, negating the differential slowdown which was perhaps Covid-19 shutdown induced. Over the past decade the rate of increase has steadied compared to the earlier years although at higher levels. Note: The historical data was revised a bit since I last checked and I re-did both charts. The record differential spike of 2015 was reduced from around 3.1, but overall very little change was observed.
Year 2020 - Posted January 15, 2021: In 2020 the relentless increase in Carbon Dioxide levels in the atmosphere continued. The rate of increase, although substantial, decreased to lowest level in six years. Earlier in 2020 there was a dramatic decrease in CO2 emissions due to Covid-19 pandemic lockdowns, withs areas of the industrial world (notably within China and India) seeing beautiful blue skies for the first time in decades. Still, the primary chart does not show even a tiny blip.
Year 2019 - Posted January 7, 2020: In 2019 the relentless increase in Carbon Dioxide levels in the atmosphere continued. There is no sign of a slowdown. The increase in 2019 was the 4th highest rate of increase since the records began in 1958, with 3 of the 4 biggest increases occurring in the last 5 years.
Year 2018 - Posted January 9, 2019: 2018 saw another substantial increase in the CO2 level and the increase was higher than the increase in 2017.
Research
Potency - Global Warming Potential: http://en.wikipedia.org/wiki/Global-warming_potential


